
Performance Pitfalls in NoSQL with Normalized Data: A Load Testing Case Study
When working with NoSQL databases like MongoDB, developers often carry over relational database habits, one of the most common being normalization. While normalization reduces redundancy in SQL-based systems, it can introduce severe performance penalties in NoSQL environments, particularly in read-heavy operations with multiple lookups.
In this article, I will present benchmark tests using Artillery to compare the performance of four variations of the same endpoint. But before diving into the results, let's talk about the theory behind NoSQL performance issues related to normalized data, aggregation design, and index optimization.
The Problem with Normalized Data in NoSQL
NoSQL databases are optimized for denormalized, document-based structures. Excessive normalization in MongoDB, for example, can lead to:
-
Frequent
$lookupoperations, which are essentially JOIN's across collections and can become bottlenecks. -
Deep nesting of pipelines, causing slower aggregation as data must be merged and filtered in memory.
-
Increased network latency, especially when large datasets are moved between collections or across shards.
These issues often go unnoticed until load testing begins or until performance issues manifest in production.
Aggregation Pipeline Order Matters
MongoDB's aggregation framework is powerful but sensitive to the order of operations. A poorly ordered pipeline can waste resources by performing expensive operations on large datasets.
Preferred Pipeline Order:
-
$match— Filter early to reduce working set size. -
$project— Trim unneeded fields. -
$lookup— Use after initial filtering to reduce the amount of data passed to the join. Make joins only when necessary. -
$unwind— Use only when necessary and as early as possible. -
$group— Perform only after narrowing data. -
$sort— Place after filtering and projection to ensure sorting a smaller dataset. Sorting large datasets without index support can be resource-intensive and should be avoided early in the pipeline.
The principle is simple: filter and reduce data as early as possible to improve performance and take advantage of indexes.
Indexes and Compound Indexes
Indexes are vital for performance in both read and write operations. In MongoDB:
-
Single-field indexes help when filtering on one field.
-
Compound indexes allow efficient queries on multiple fields.
-
The index field order matters, especially when dealing with range queries and sorting.
Failure to use or optimize indexes can result in full collection scans, leading to slow responses and timeouts.
In the benchmark results, Stage 3 used two single-field indexes to support basic $match and $lookup operations:
// stage03
db.collection("orders").createIndex({ customerId: 1 });
db.collection("order_items").createIndex({ orderId: 1 });
On the other hand, Stage 4 benefited from a compound index that covered both filter and sort operations, significantly improving performance:
// stage04
db.collection("orders_summary").createIndex({
  "customerId.buffer": 1,
  totalRevenue: -1,
});
This strategic use of compound indexing allowed Stage 4 to avoid costly in-memory sorts and unnecessary collection scans, resulting in much faster response times.
Load Test Comparison
The /orders?stage=X endpoint was tested under uniform load using Artillery to simulate real-world traffic. Each stage represents a variation in query and aggregation logic.
Test Setup
-
Tool: Artillery
-
Test Duration: 30 seconds
-
Arrival Rate: 5 virtual users (VU's) per second
-
Timeout: 60s
-
Scenarios: 4 (each with a different stage)
All stages used the same load configuration to ensure consistent comparison.
Test YAML Reference
config:
  target: "http://localhost:3000"
http:
  timeout: 60
  phases:
    - duration: 30
      arrivalRate: 5
scenarios:
  - flow:
      - get:
          url: "/orders/{customerId}?stage={stageId}"
Results
The table below presents detailed metrics gathered from running the load test on each stage. It highlights key performance indicators such as request completion rate, average response time, and error occurrences, allowing a clear comparison of how each stage handled the simulated load.
| Stage | Status | Behavior | Notes | Response Time (Median) | Response Time (max) |
|---|---|---|---|---|---|
| 1 - Bad aggregation, no indexes | ❌ Timeout | No response within 10s | All requests timed out | >60s | >60s |
| 2 - Improved aggregation with no indexes | ⚠️ Partially Completed | No response within 10s | 8.7% of requests failed with timeout | 55.1s | 59.8s |
| 3 - Improved aggregation with indexes | ✅ Completed | Handled the load normally | Response times acceptable under configured load | 1s | 2s |
| 4 - Denormalized collection with compound index | ✅ Completed | Fastest | Performed significantly faster than stage 3 | 201ms | 617ms |
Below are the Artillery load test screenshots for each stage, illustrating the real-time performance metrics such as request rates, response times, and error counts. These visuals provide a clearer understanding of how each stage behaved under load and complement the summarized data presented above.
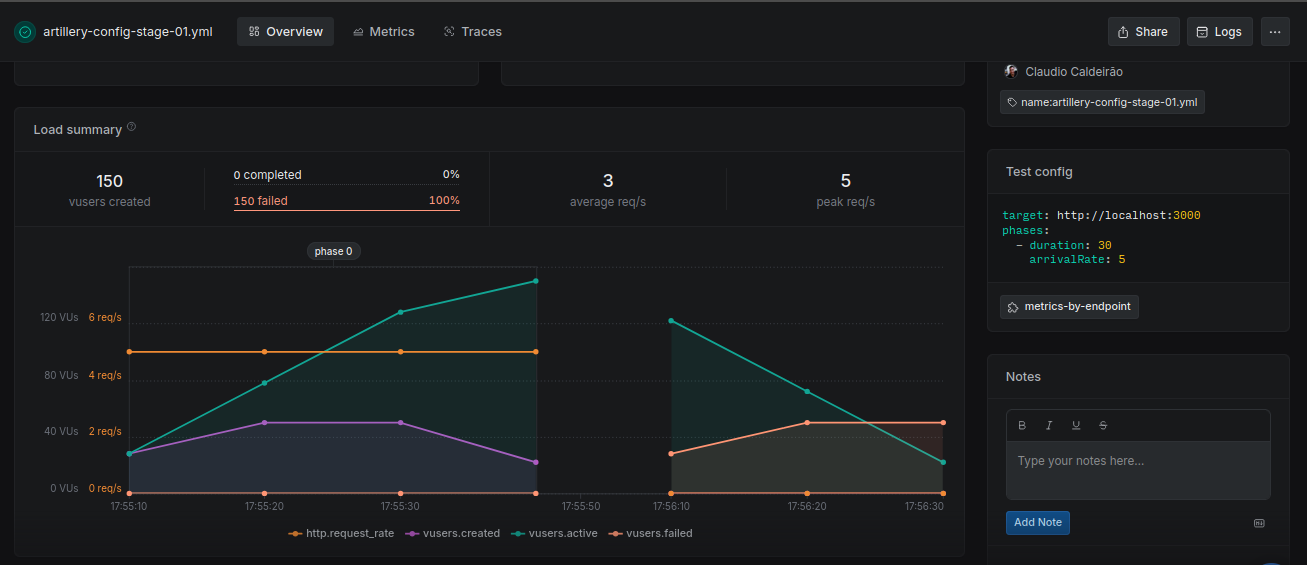
Stage01
All requests timed out, indicating severe performance issues—likely due to unindexed queries and inefficient aggregation pipelines.
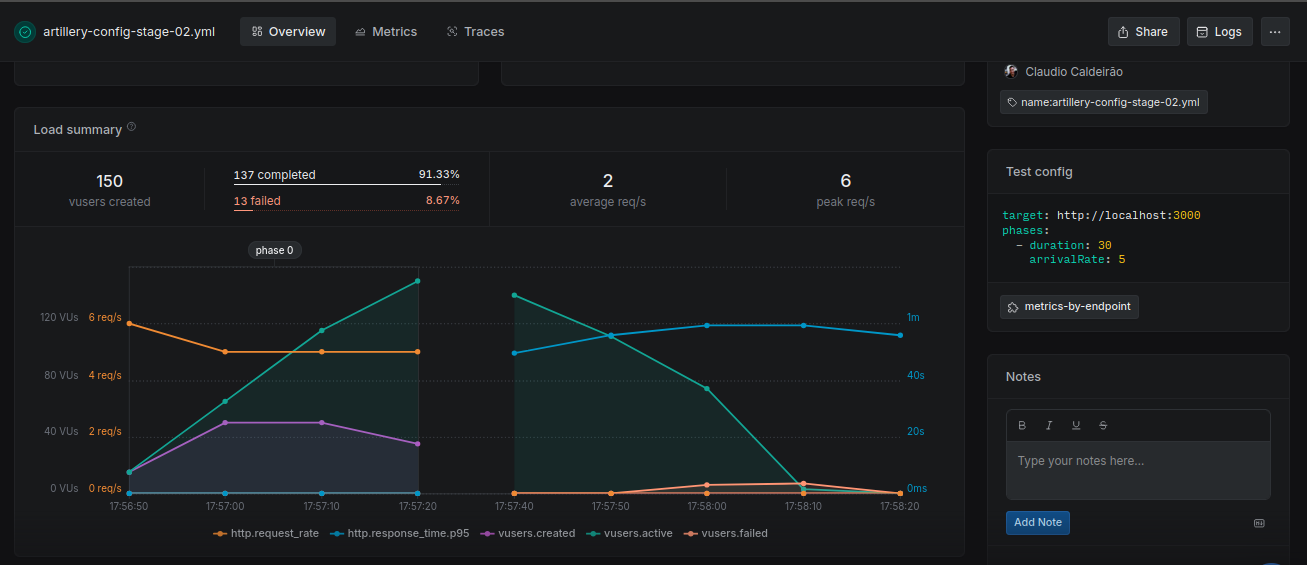
Stage02
Slight improvement over Stage 1, but still resulted in timeouts. Performance remains unacceptable, possibly due to similar structural problems with minor adjustments.
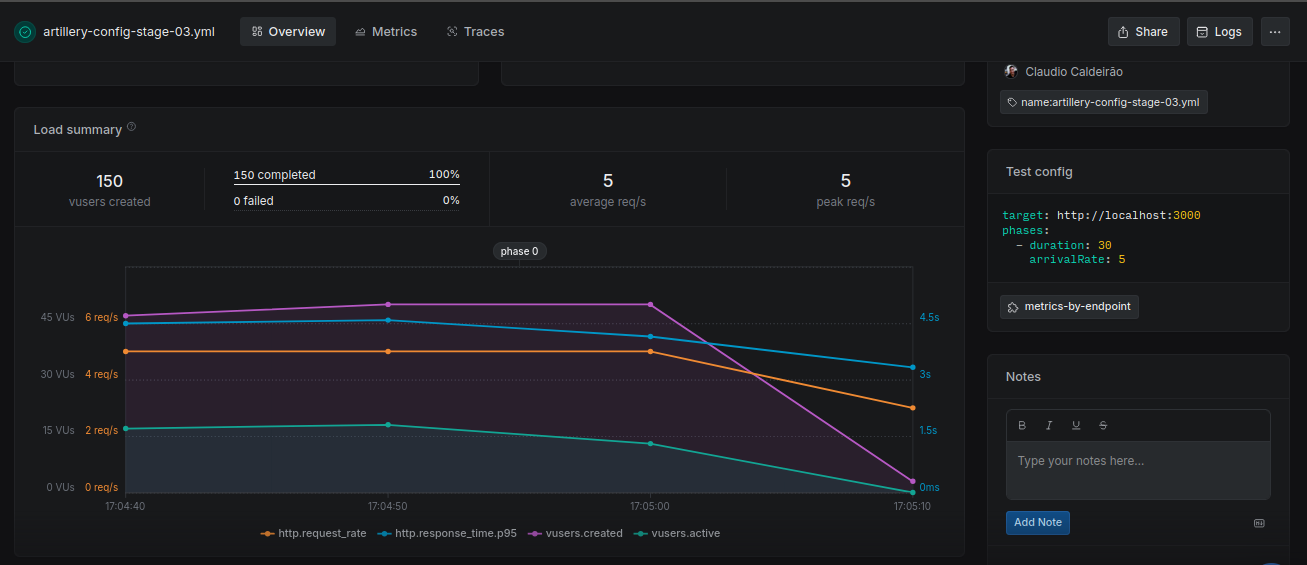
Stage03
All requests completed successfully with moderate response times. This improvement reflects the use of indexes and better aggregation pipeline ordering.
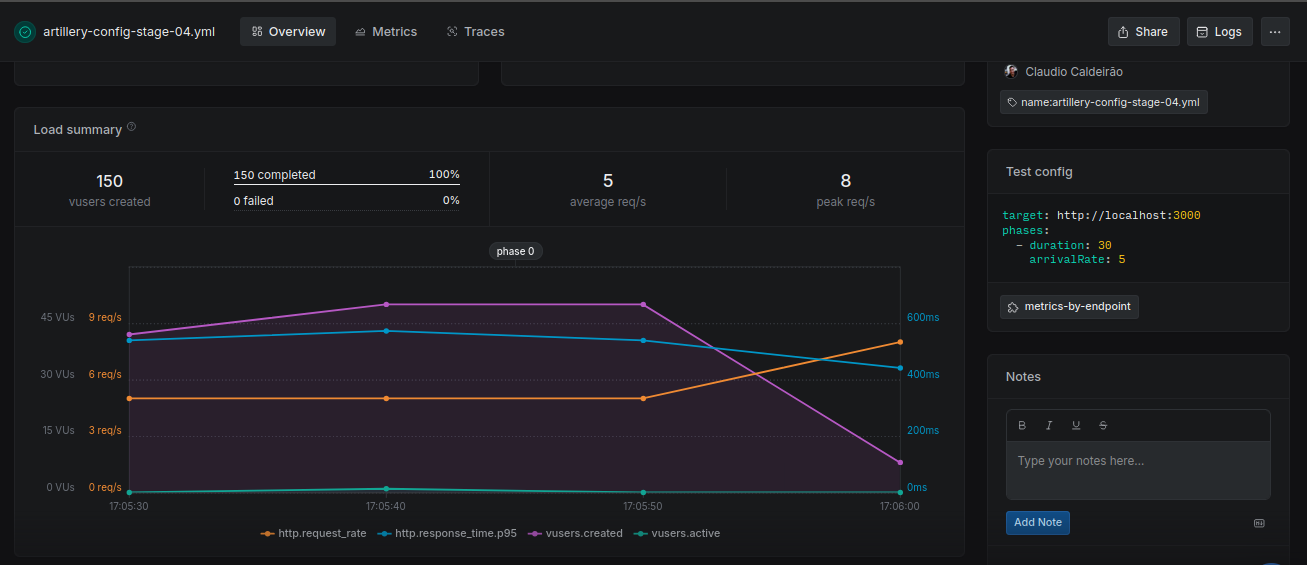
Stage04
Superior performance under the same load conditions. The use of a denormalized structure and a compound index significantly reduced processing time and improved throughput.
Summary
This case study demonstrates that addressing common mistakes in NoSQL schema design (especially excessive normalization and poor aggregation strategies) can lead to substantial performance gains under load.
Proper use of indexes significantly reduces query time by avoiding full collection scans, while denormalizing data (when read performance is a priority) helps eliminate costly $lookup operations. Although denormalization can increase the complexity of updates, the trade-off is often worthwhile for read-heavy systems where speed and scalability are critical.